Citation
Marr, B. (2005), "Business performance measurement: an overview of the current state of use in the USA", Measuring Business Excellence, Vol. 9 No. 3. https://doi.org/10.1108/mbe.2005.26709caf.006
Publisher
:Emerald Group Publishing Limited
Copyright © 2005, Emerald Group Publishing Limited
Business performance measurement: an overview of the current state of use in the USA
Business performance measurement: an overview of the current state of use in the USA
Introduction
It seems that business performance measurement and management (BPM) approaches are being adopted pervasively regardless of industry or context. Of the numerous BPM approaches the balanced scorecard (BSC) (Kaplan and Norton, 1992, 1996) seems the most popular methodology, which today seems to have become synonymous with BPM (Marr and Schiuma, 2003). Various studies have suggested that up to 60 percent companies in the USA have experimented with the BSC (see e.g. Silk, 1998) and a survey of management techniques and tools found the BSC to be one of the most popular management tools, with about 44 percent of organisations in North America utilising it (see Rigby, 2001).
A serious problem is presented by the fact that today the BSC, and with it BPM, is far from being a clearly definable concept (see e.g. Ittner et al., 2003; Speckbacher et al., 2003). The BSC has evolved and morphed from measurement tool to strategic change framework, and most recently to a tool to measure the readiness of intangible value drivers (see e.g. Marr and Adams, 2004). The BSC therefore lends itself to various interpretations (Braam and Nijssen, 2004, p.336) and it is hard to know what a company means when it says it has a BSC. In a recent study of BSC usage in German-speaking countries, Speckbacher et al. (2003) made this problem explicit as they identified tree different types or interpretations of BSCs used by firms: A Type I BSC is defined as a performance measurement system that implies a specific approach to measuring intangibles, where intangibles are identified and measured by non-financial strategic measures rather than by their financial value. A Type II BSC is a multidimensional performance measurement system (in the sense of Type I) that chooses a specific approach to describe strategy by using a sequential cause-and-effect logic to link tangible and intangible assets. And a Type III BSC is defined as a Type II BSC that additionally implements the organization strategy by defining objectives, action plans and results, and by linking incentives to BSC measures. The study also found that only 26 percent of firms used a BSC with most of them using only a limited or incomplete version of the BSC (Speckbacher et al,, 2003).
Considerable disagreement about the definition of BPM and BSC, as well as the evidence of different companies interpreting the BSC in different ways, calls into question the findings of earlier surveys. Furthermore, the fact that many earlier studies relied on estimations or small sample sizes further complicates the issue of how many companies actually use BPM approaches. The aim of this study is to understand the current state of use in the 5,000 largest US companies. The paper reports on the descriptive part of the study and outlines what approaches these companies use and what they mean when thee say e.g. that they are using a BSC. Moreover, the paper outlines if and which supporting software tools are used, as well as the perceived impact of BPM approaches used in US companies.
However, before I go any further I would like to provide a definition of what I mean by BPM:
BPM is defined as the organizational approach to assess and monitor performance in relation to set goals and objectives. It encompasses methodologies, frameworks, and indicators that are then used to help organizations in the formulation and assessment of the strategy, to motivate people, and to communicate or report performance to external stakeholders.
The assumption is made that all organizations use indicators to measure aspects of their performance; however, I use the term formal BPM approach when the methodologies, frameworks, and indicators are made explicit in organizations, and if they are codified into processes and policy. Formal approaches towards BPM include the balanced scorecard, the performance prism (Neely et al., 2002), quality based measurement tools (e.g. TQM or Baldrige criteria), and economic value assessment models (e.g. EVA™).
The remainder of this paper is arranged as follows. I will first outline the methodology used to collect the data and then present and discuss the findings in various areas before I draw up some relevant conclusions.
Methodology
The Perfect Analysis database product was used to identify the 5,000 largest companies in the USA based on their total revenue. Together with a cover letter, a copy of the survey was sent to the chief executive officers (CEO) and chief financial officers (CFO) of 5,000 largest companies in the USA. Respondents were provided with a web link and encouraged to complete the survey online, which gave respondents immediate access to benchmarking information based on other respondents as well as on a pre-study literature review. To provide further incentive to respond the cover letter indicted that the first 100 respondents would receive a copy of a management book on business performance management. In total, 780 usable responses were received back, which correspond with a 16 percent response rate. All respondents were asked to reply for the company as a whole (not for any particular subsidiary or division) and were assured that all responses will be treated as confidential. The cover letter and survey stated that only aggregates will be used for the research and that no individual company will be linked to specific responses.
BPM in large US firms
In this section I summarise and discuss the descriptive findings from the research, broken down into general usage of BPM, IT support used for the implementation and the link between organisational performance and the usage of BPM approaches.
Usage of BPM approaches
Of all 780 respondents, 46 percent of companies stated that they follow a formal BPM methodology. Of these 359 organisations, 276 used the BSC as the main methodology; 61 used quality-based approaches such as total quality management, Baldrige, or six sigma; and about 21 relied on economic value added (EVA™) as the main methodology. This meant that overall only about 35 percent of the 5,000 largest US firms used the BSC, which is significantly lower then the 44 percent reported by Rigby (2001) and higher than the numbers reported by Speckbacher et al. (2003). However, only about 14 percent of respondents to the study reported in this paper relied solely on the BSC as their performance measurement tool, many firms combined it with other methodologies – most common combinations were BSC with TQM or Baldrige, or BSC and EVA™.
There are different reasons why companies implement BPM. For example, Marr et al. (2003) identified three primary drivers for organisations to measure performance. These are:
- 1.
implementation of strategy;
- 2.
influencing people’s behaviour; and
- 3.
external validation of performance.
This study found that the primary reason for having a BPM system was controlling (30 percent) followed by strategic planning (19 percent) and decision making (18 percent) (see Table I). Controlling is most closely linked to the accounting and finance function in firms and it is interesting that despite the continuous call for more strategic measurement systems, controlling remains at the top of the list.

Different BPM approaches propose different perspectives of performance that should be measured. While the BSC, for example, proposes to measure performance in the financial, customer, internal processes and learning and growth perspectives; the performance prism, on the other hand, suggest to measure performance in the stakeholder needs, stakeholder contributions, strategies, processes, and capabilities perspectives (Neely et al., 2002). Speckbacher et al. (2003) found in their study of BSC usage that a third of BSC users have no ”learning and growth” perspective. This study found that most formal BPM approaches used by firms measured performance in three or four different perspectives. It is interesting to highlight that of the 780 firms in this study not one claimed to measure their “learning and growth” perspective as such, including BSC users! It should be noted, of course, that many organisations reinterpret the learning and growth perspective either as people or employee perspective (52 percent of respondents included this perspective) or innovation perspective as it was named in the first version of the BSC (22 percent of respondents included this perspective). In my view this highlights a problem that BSC users struggle to understand the content of the learning and growth perspective, which according to Kaplan and Norton (2004) is the most important perspective of the four BSC perspectives. In total, 96 percent of firms in this study measured the financial perspective as part of their BPM approach. While this figure corresponds with findings by Speckbacher et al. (2003), who found that only 95 percent of BSC users measured financial performance, it raises a question of why 4 percent of firms in our study did not include financial performance in their BPM system. The percentages of firms measuring other perspectives of performance in their BPM approaches went down (see Table II), starting from customer perspective (69 percent), processes perspective (64 percent), employee (or people) perspective (52 percent), health and safety (24 percent), innovation (22 percent), and other stakeholders (10 percent).

The data from this study indicate that companies with a formal BPM approach placed more emphasis on their non-financial measures. In companies without a formal BPM approach, 31 percent say that over three-quarters of their measures are financial and 64 percent say that over half of their measures are financial. In companies with a formal performance measurement system this number went down. Only 5 percent stated that more than three-quarters of their measures are financial and only 21 percent reported that more than half of their measures are financial ones.
In order to understand how longer-term, non-financial objectives translate into value, Kaplan and Norton (2004, 2000) suggest visually mapping the causal relationships between strategic objective and their measures into a strategy map. Based on the perspectives of the balanced scorecard (Kaplan and Norton, 1992, 1996a, b, c) a strategy map contains outcome measures and performance drivers linked together in a cause-and-effect diagram. Ittner et al. (2003) also suggest that firms use causal models and find that those firms who consistently build and verified their causal models had a 2.95 percent higher ROA and 5.14 percent higher ROE than companies that did not use causal models. In their survey of 157 companies, Ittner et al. (2003) found that, only 23 percent of companies consistently built and verified causal models. In our sample, 54 percent of respondents with a formal BPM approach stated that they visualised causal links between measures using cause-and-effect diagrams such as strategy maps. This corresponds with findings by Speckbacher et al. (2003) who found that about half of companies using a BSC also use causal maps. However, in our sample only about half of companies with a formal BPM approach claimed to test causal relationships between measures, which is in line with the 23 percent identified by Ittner et al. (2003).
Software support for BPM
The software market for solutions and applications for measuring and managing corporate performance is growing constantly and in this year there are over 65 software vendors world-wide trying to get their share of the multi-billion dollar analytic application market (Marr and Neely, 2003a, b). Classe (1999) noted that paper and pencil, or simple spreadsheet tools might be sufficient to start applying a performance measurement tool such as the balanced scorecard, but to make the method an integral part of the business, automation will usually be necessary. Sharman and Kavan (1999) add that paper-based measurement systems are too slow, cumbersome, labour intensive and unreliable. In this study, the majority of firms (45 percent) used spreadsheet applications, such as Microsoft Excel, as the prime tool for their BPM; 28 percent used enterprise resource planning (ERP) systems as their main tool; 15 percent used packaged BPM applications, and 12 percent used custom build applications (see Table III). Many companies combined applications such as ERP systems and spreadsheet applications with custom built applications.

Overall, 34 percent of respondents reported that their applications used for BPM worked well or very well and 46 percent reported it worked acceptably. Overall, only 20 percent of respondents reported that their application used for performance measurement and management worked poorly. By splitting those into the different categories of applications, we were able to see that users were most satisfied with packaged applications. Not one respondent reported that the applications performed poorly; about three-quarters of the respondents using packaged applications reported that they worked well or even very well. Custom-built applications followed in second place as half of the respondents using custom-built applications for their BPM reported that they worked either well or very well, while 44 percent reported acceptable performance. When it came to ERP systems, over half of the respondents which used ERP solutions for their performance measurement and management felt that they only performed acceptably; 33 percent felt they worked well; and only 2 percent believed they worked very well whereas 11 percent felt they worked poorly. Users felt most unhappy about their spreadsheet applications: 18 percent felt that they worked poorly as tools to measure and manage performance. Only one quarter of the respondents using spreadsheets felt that they worked well or very well as BPM tools.
BPM and firm performance
There is evidence in the literature showing a positive impact of BPM on communication effectiveness, collaboration, and the extraction of valuable insights and decisions. This study tried to test some of these claims.
The respondents with a formal BPM approach reported higher effectiveness of their overall communication of performance measurement results: 51 percent of the respondents with a formal BPM approach agreed or strongly agreed that their communication of performance data is effective; whereas only 23 percent of the respondents without a formal BPM approach felt that way about the overall effectiveness of their communication of performance results.
Overall, fewer respondents felt that communication and collaboration was supported well or very well (only 23 percent) and more respondents felt that collaboration was supported poorly (28 percent). About half of the respondents felt that collaboration was supported acceptably. Respondents were most happy with the collaboration support of packaged applications and custom-built applications. According to the results in this study, respondents felt that spreadsheet applications supported collaboration the least.
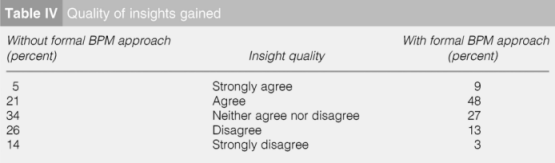
Most organisations seem to spend the majority of their time and effort on collecting and reporting data and not enough time on extracting valuable and actionable insights from their performance data (Ittner et al., 2003). The number of measures and the amount of performance data seem to grow constantly whereas the insights seem to decrease – this phenomenon could be described as “drowning in data” or “paralysis without analysis” (Neely et al., 2002). This study found that respondents with a formal BPM approach reported better satisfaction with the insights they gained from their performance data; 57 percent of the respondents with a formal BPM approach agreed or strongly agreed that they gained high quality insights from their performance data (see Table IV); whereas only 26 percent of the respondents without a formal BPM approach felt that way about their management insights gained from performance information. Most respondents agreed or strongly agreed with the statement that the BPM approach had improved the quality of their data interpretation (61 percent).
Finally, all respondents were asked to rank their firm’s performance along all relevant dimensions of performance compared to their main competitors. The survey provides preliminary evidence that organisations that follow a formal BPM methodology to manage their corporate performance outperform the organisations without a formal methodology to managing corporate performance. While such self-assessments have proven to be reliable (see e.g. Ketokivi and Schroeder, 2004; Boyd et al., 1993; Venkatraman and Ramanujam, 1987) archival data about firm performance will be used in a next step of the research to triangulate these findings.
Conclusions
The findings of this survey provide insights into the usage of BPM approaches in large US firms, which were then compared with findings obtained in previous studies in Europe and the USA. This survey did not confirm earlier findings by Rigby (2001) that 44 percent of companies in the USA use a BSC. Instead, this study found that only 35 percent of large US firms used the BSC approach. However, the findings indicate that the usage level in the USA is higher than in Germany, Switzerland, and Austria (26 percent found by Speckbacher et al., 2003).
This study confirmed various aspects of the study conducted by Speckbacher et al. (2003). First, it confirmed that many firms who claim to use the BSC approach in fact only use a limited or incomplete version of the BSC. Whereas Speckbacher et al. found that, for example, a third of organisations with a BSC do not have a “learning and growth perspective”, this study found that none of the firms actually claim to have a learning and growth perspective. This difference might be due to the fact that the question was asked differently, as this study asked firms to name the performance perspectives they are measuring. In the Speckbacher et al. study, the authors refer to “learning and growth or comparable”, and in our study companies refer to innovation and people, often included in the learning and growth perspective. Including these would confirm the findings in Germany, Austria, and Switzerland.
This study also confirmed earlier findings in terms of how many companies visualise links between measures: 54 percent of respondents with a formal BPM approach stated that they visualised causal links between measures using cause-and-effect diagrams such as strategy maps. This corresponds with findings by Speckbacher et al. (2003) who found that about half of companies using a BSC also use causal maps.
Our findings of software applications used to automate BPM confirmed earlier findings that most organisations actually rely on spreadsheet or ERP applications. However, our investigation about the satisfaction levels also confirmed many concerns expressed in both academic and practitioner literature about the limitation of such applications for the usage as BPM applications.
Our preliminary findings regarding BPM and firm performance showed initial support that organisations with a formal BPM approach outperform those firms which have no formal approach to BPM. Performance differences are identified on various dimensions which indicate that BPM improves communication, insight quality, and interpretation quality. However, these findings should be subject to further research.
Acknowledgements
The author would like to acknowledge the funding provided by Hyperion Solutions, Inc. which enabled him to conduct this research.
Bernard MarrResearch Fellow in the Centre for Business Performance at Cranfield School of Management, Cranfield, UK and a Visiting Professor at the University of Basilicata, Italy. Currently, he heads various international research and consulting projects on strategic value creation and business performance management. He has published over 100 books, reports, and articles on related topics such as balanced scorecard, strategy maps, intellectual capital, intangible assets, and performance management software applications. He is a member of editorial boards of many leading journals in the field and is a frequent keynote presenter at international conferences.
References
Boyd, B.K., Dess, G.G. and Rasheed, A.M.A. (1993), “Divergence between archival and perceptional measures of the environment: causes and consequences”, Academy of Management Review, Vol. 18 No. 2, pp. 204–26
Braam, G.J.M. and Nijssen, E. (2004), “Performance effects of using the balanced scorecard: a note on the Dutch experience”, Long Range Planning, Vol. 37 No. 4, pp. 351–66
Classe, A. (1999), “Performance anxiety”, Accountancy, Vol. 123 No. 1267, pp. 56–8
Ittner, C.D. and Larcker, D.F. (1998), “Are non-financial measures leading indicators of financial performance? An analysis of customer satisfaction”, Journal of Accounting Research, Vol. 36, Supplement, pp. 1–36
Ittner, C.D., Larcker, D.F. and Randall, T. (2003), “Performance implications of strategic performance measurement in financial service firms”, Accounting, Organizations and Society, Vol. 28 Nos 7-8, pp. 715–41
Kaplan, R.S. and Norton, D.P. (1992), “The balanced scorecard: measures that drive performance”, Harvard Business Review, Vol. 70 No. 1, pp. 71–9
Kaplan, R.S. and Norton, D.P. (1996a), The Balanced Scorecard: Translating Strategy into Action, Harvard Business School Press, Boston, MA
Kaplan, R.S. and Norton, D.P. (1996b), “Linking the balanced scorecard to strategy”, California Management Review, Vol. 39 No. 1, pp. 53–79
Kaplan, R.S. and Norton, D.P. (1996c), “Using the balanced scorecard as a strategic management system”, Harvard Business Review, Vol. 74 No. 1, pp. 75–85
Kaplan, R.S. and Norton, D.P. (2000), “Having trouble with your strategy? Then map it”, Harvard Business Review, Vol. 78 No. 5, pp. 167–76
Kaplan, R.S. and Norton, D.P. (2004), Strategy Maps: Converting Intangible Assets into Tangible Outcomes, Harvard Business School Press, Boston, MA
Ketokivi, M.A. and Schroeder, R.G. (2004), “Perceptional measures of performance: fact or fiction?”, Journal of Operations Management, Vol. 22 No. 3, pp. 247–64
Marr, B. and Adams, C. (2004), “The balanced scorecard and intangible assets: similar ideas, unaligned concepts”, Measuring Business Excellence, Vol. 8 No. 3, pp. 18–27
Marr, B. and Neely, A. (2003a), Automating Your Scorecard: The Balanced Scorecard Software Report, InfoEdge (Gartner), Stamford, CT
Marr, B. and Neely, A. (2003b), “Balanced scorecard: verstehen und auswahlen von software anwendungen für strategieorientierte unternehmen”, Controlling & Management, Vol. 47 No. 4, pp. 237–40
Marr, B. and Schiuma, G. (2003), “Business performance measurement: past, present, and future”, Management Decision, Vol. 41 No. 8, pp. 680–7
Neely, A., Adams, C. and Kennerley, M. (2002), The Performance Prism: The Scorecard for Measuring and Managing Business Success, Financial Times Prentice-Hall, London
Rigby, D. (2001), “Management tools and techniques: a survey”, California Management Review, Vol. 43 No. 2, pp. 139–60
Sharman, P. and Kavan, C.B. (1999), “Software is not the solution: software selection’s effect on implementing the balanced scorecard”, Journal of Strategic Performance Measurement, February/March, pp. 7–15
Silk, S. (1998), “Automating the balanced scorecard”, Management Accounting, Vol. 11 No. 17, pp. 38–44
Speckbacher, G., Bischof, J. and Pfeiffer, T. (2003), “A descriptive analysis on the implementation of balanced scorecards in German-speaking countries”, Management Accounting Research, Vol. 14 No. 4, pp. 361–87
Venkatraman, N. and Ramanujam, V. (1987), “Measurement of business economic performance: an examination of method convergence”, Journal of Management, Vol. 13 No. 1, pp. 109–12
Further Reading
Norreklit, H. (2000a), “The balance on the balanced scorecard: a critical analysis of some of its assumptions”, Management Accounting Research, Vol. 11 No. 1, pp. 65–88
Norreklit, H. (2000b), “The balanced scorecard: what is the score? A rhetorical analysis of the balanced scorecard”, Accounting, Organizations and Society, Vol. 28 No. 6, pp. 591–619
Rucci, A.J., Kirn, S.P. and Quinn, R.T. (1998), “The employee-customer profit chain at Sears”, Harvard Business Review, Vol. 76 No. 1, pp. 82–98