Citation
(2009), "International Housing Data", International Journal of Housing Markets and Analysis, Vol. 2 No. 3. https://doi.org/10.1108/ijhma.2009.35102cab.001
Publisher
:Emerald Group Publishing Limited
Copyright © 2009, Emerald Group Publishing Limited
International Housing Data
Article Type: International Housing Data From: International Journal of Housing Markets and Analysis, Volume 2, Issue 3.
The aim of this section is to provide an overview of relevant housing market trends in individual countries. Each issue includes data relating to different global markets which enables a comparison to be made between different countries in their respective global regions. The International Journal of Housing Markets and Analysis seeks to provide a unique global insight into these markets via this data. Feedback and suggestions are sought and can be forwarded to the editor Professor Richard Reed.
UK house prices
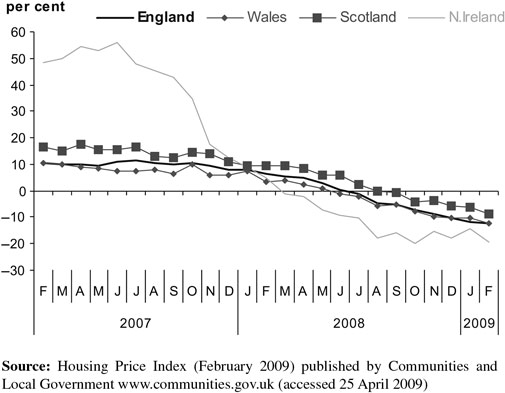
Figure 1 plots the decline in UK annual house price inflation over the course of the downturn. At the commencement of this relatively short two year period UK house prices were realising healthy returns exceeding 10 per cent. A distinct turning point can be observed in the last quarter of 2007 which led to returns exceeding 10 per cent, equating to a difference of more than 20 per cent.

Figure 1. UK annual house price rates of change (all dwellings)
A closer examination of the UK housing market in Figure 2 highlights differences between the four countries over the same time period. A high level of volatility can be observed in house prices in the Northern Ireland market where the increases exceeded 50 per cent per year in the middle of 2007, although by early 2009 this trend reversed to a decrease exceeding 20 per cent. From early 2008 onwards the Scottish market held up better than the other three countries, equating to a premium of approximately 5 per cent.
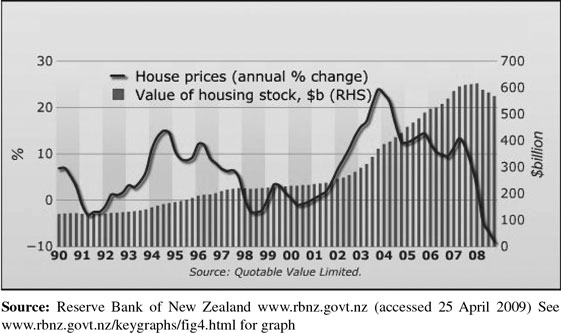
New Zealand house prices
To draw a comparison with a country remotely located from the UK, trends in the New Zealand housing markets are presented in Figure 3 which also followed the global boom-bust cycles. Focussing on house prices over the relatively short 2007-2009 period the market sharply showed 10 per cent returns although in early 2007 was showing positive returns in excess of 10 per cent, being similar to UK house prices.
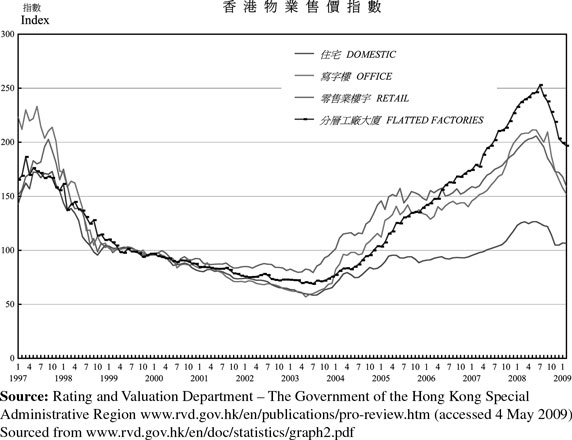
Hong Kong house prices
An overview of the Hong Kong market from 1997 to 2009 is provided in Figure 4. This diagram allows a direct comparison between domestic residential property with other major land uses in Hong Kong including office, retail and industrial. In the period from 1997 to 2003 it can be noted there was a close correlation between all four land uses, however the period from 2003 to 2009 highlighted a deviation. It can be observed that domestic residential, in contrast to the other land uses, did not experience the speculative boom exceeding a 250 per cent increase over this period but also is not accompanied by a sharp decline. This may be partly due to the effect of the global economic crisis which directly resulted in an oversupply situation in the three other land uses.