
The Conundrum of Measuring Children’s Primary Health Care
Issues and Opportunities in Primary Health Care for Children in Europe
ISBN: 978-1-78973-354-9, eISBN: 978-1-78973-351-8
Publication date: 6 May 2019
Abstract
Evaluating primary care for children has not before been undertaken on a national level, and only infrequently on an international level, an adult-focused perspective is the norm. The Models of Child Health Appraised (MOCHA) project explored the evaluation of quality of primary care for children in a nationally comparable way, which recognises the influence of all components of child well-being and well-becoming. Using adult-focused metrics fails to account for children’s physical and psycho-social development at different ages, differences in health and non-health determinants, patterns of disease and risk factors and the stages of the life course. To do this, we attempted to identify comparable measures of child health in the European Union and European Economic Area countries, we aimed to perform a structural equation modelling technique to identify causal effects of certain policies or procedures in children’s primary care and we aimed to identify and interrogate large datasets for key tracer conditions. We found that the creation of comparative data for children and child health services remains a low priority in Europe, and the largely unmet need for indicators covering all the healthcare dimensions hampers development of evidence-based policy. In terms of the MOCHA project objective of appraising models of child primary health care, the results of this specific work show that the means of appraisal of system and service quality are not yet agreed or mature, as well as having inadequate data to fuel them.
Keywords
Citation
Rocco, I., Corso, B., Luzi, D., Pecoraro, F., Tamburis, O., Hoang, U., Liyanage, H., Ferreira, F., de Lusignan, S. and Minicuci, N. (2019), "The Conundrum of Measuring Children’s Primary Health Care", Blair, M., Rigby, M. and Alexander, D. (Ed.) Issues and Opportunities in Primary Health Care for Children in Europe, Emerald Publishing Limited, Leeds, pp. 159-178. https://doi.org/10.1108/978-1-78973-351-820191012
Publisher
:Emerald Publishing Limited
Copyright © 2019 European Commission
License
This chapter is published under the Creative Commons Attribution (CC BY 4.0) licence. Anyone may reproduce, distribute, translate and create derivative works of this chapter (for both commercial and non-commercial purposes), subject to full attribution to the original publication and authors. The full terms of this licence may be seen at http://creativecommons.org/licences/by/4.0/legalcode
Efforts Towards a Comprehensive Populated Framework for the Appraisal of the Child Healthcare System
Assessment of the quality of overall health systems is most frequently undertaken at international level. The need to develop child-focused and child-centric healthcare system quality measurements has been claimed since the 1990s (Peoples-Sheps et al., 1998) and was taken forward systematically in the European Union by the Child Health Indicators of Life and Development (CHILD) project (Rigby, Köhler, Blair, & Mechtler, 2003). However, the evaluation of primary care for children across countries is not so widely explored, especially at European level, nor is a common agreed optimum model of care encompassing all components that influence child well-being and well-becoming. Although efforts in this direction are increasing (Wolfe et al., 2013), cross-country comparisons tend to be based on disease incidence (Cattaneo, Cogoy, Macaluso, & Tamburlini, 2012), on a limited number of countries (Kavanagh, Adams, & Wang, 2009), on specific aspects, such as poverty (Ortiz, Daniels, & Engilbertsdóttir, 2012) or policy (Chapple & Richardson, 2009).
Moreover, the multidimensional approach adopted to evaluate child care strongly support the acknowledgement that a simple extrapolation of adult metrics should be avoided taking instead into account children’s physical and psycho-social development at all age, differences in health and non-health determinants and patterns of diseases and risk factors, recognising the stages of the life course (World Health Organization Regional Office for Europe, 2005a; World Health Organization Regional Office for Europe, 2014). A framework as to what information was needed for child health service strategic planning was created to link with policy development (World Health Organization Regional Office for Europe, 2005b).
The need for a defined framework for the healthcare evaluation that is suitable for children still remains despite the earlier work. Creation of comparative data for children and child health services still remains a low priority, and the largely unmet need for indicators covering all the healthcare dimensions and available for the totality of the Models of Child Health Appraised (MOCHA) countries is shown up as hampering development of evidence-based policy. This is explained in detail in Liyanage, Hoang, Ferreira, and de Lusignan (2018).
Recognising the lack of centrally published relevant and sensitive indicators, and with the aim of identifying measures specifically relevant to child healthcare, the leaders of the MOCHA Working Groups had the assignment to scrutinise the answers received during the rounds of Country Agents (CAs) questions and provide relevant measures for the mapping of models of provision in MOCHA countries in a way which it was planned would permit the assessment of quality at the system level. The gathered measures were analysed by an expert group that identified a limited number of categories within which all the measures could be classified. The selected categories were as follows: Context, Access, Coordination and Governance.
Due to the close link among categories, the process of classification of the measures was particularly time-consuming to result in the univocal classification of each measure. However, this was tackled, and the subject experts within MOCHA proceeded with the examination of each measure:
verifying whether the interpretation of the measure meaning was univocal, that is not ambiguous with respect to the direction of changes in the pertinent category; and
transforming the measure into score ranging from 1 (weak primary care) to 3 (strong primary care), based on literature and experts’ expertise. For example, if a country indicated having a Child Public Health EHR System using e-health records, which is one of the measures belonging to the Coordination category, for both immunisation and screening, then the country scored a ‘3’ on that measure, meaning a feature of strong coordination.
Since the above-mentioned requirements constitute a precondition to compute a category-specific score, the experts’ judgement pointed out which measures were not univocally interpretable. Let’s consider, for example, the measure ‘Number of physicians/paediatric per 100,000 population’, classified in the Access category. Would a higher number of physicians/paediatrician produce a higher accessibility to care (univocal interpretation)? In the literature, there was no evidence of an optimal rate of the number of physicians/paediatrician per 100,000 population and consequently the MOCHA experts could not reach an agreement about its univocal interpretability towards the best efficiency in the access to care.
Therefore, this measure could not have been included in the computation of the category-specific (Access) score.
This verification, along with the issue of missing data encountered for some measures, has strongly restricted the potential analysis of the models of provision in MOCHA countries.
However, the Coordination category did fulfil the required criteria and the following example shows the methodology employed to produce the category-specific score.
Identification of the Measures Related to the Category
Among the measures provided by MOCHA WP-leaders, those classified in the Coordination category, which met the univocal interpretation precondition, are listed in the table below (Table 8.1). Two measures, (C3 and C5) are quantitative, while the remaining three are categorical.
Measures identified by WP-leader related to coordination and assumed values.
| Measures Identified by WP-leader Related to Coordination | Possible Values |
|---|---|
| C1. Procedures to refer the child from primary to secondary care |
|
| C2. Formal link between social care and primary care health services |
|
| C3. EHR usage in primary care |
|
| C4. Child public health EHR system in use e-health records (primary care EHR/immunisation registration) |
|
| C5. e-health infrastructure for sharing with other sectors |
|
Transformation of the Measures into Scores
The measures belonging to the Coordination category were transformed into scores ranging from 1 (weak coordination) to 3 (strong coordination) (Table 8.2).
Measures identified by WP-leader related to coordination and attributed scores.
| Measures Identified by WP-leader Related to Coordination | Scores |
|---|---|
| C1. Procedures to refer the child from primary to secondary care |
|
| C2. Formal link between social care and primary care health services |
|
| C3. EHR usage in primary care |
|
| C4. Child public health EHR system in use e-health records (primary care EHR/immunisation registration) |
|
| C5. e-health infrastructure for sharing with other sectors |
|
Observing the scores assumed in the Coordination measures by the 30 MOCHA countries (Table 8.3), it emerged that Lithuania has the lowest scores (minimum score for all the measures), while Italy has the highest scores (maximum score for all the measures).
Scores assumed in the coordination measures by the MOCHA countries.

|
Analysis of the Correlation between Measures Belonging to the Same Category
The analysis of the correlation among the measures classified in the Coordination category showed all positive associations (Table 8.4), confirming that the scores attributed to the measures have the same direction. In particular, although the low number of countries, the Kendall’s (1938) correlations among the C3, C4 and C5 measures resulted statistically significant. Consequently, only the three EHR measures, significantly correlated, were considered for the analysis. Given the nature of these measures, the category ‘Coordination’ will be subsequently referred as ‘e-coordination’.
Kendall’s correlation matrix (*p < 0.05).
| C1 | C2 | C3 | C4 | C5 | |
|---|---|---|---|---|---|
| C1 | 1.000 | 0.174 | 0.217 | 0.272 | 0.304 |
| n = 23 | n = 21 | n = 23 | n = 21 | n = 22 | |
| C2 | 0.174 | 1.000 | 0.275 | 0.23361 | 0.259 |
| n = 21 | n = 25 | n = 25 | n = 24 | n = 25 | |
| C3 | 0.217 | 0.275 | 1.000 | 0.614* | 0.416* |
| n = 23 | n = 25 | n = 29 | n = 26 | n = 27 | |
| C4 | 0.272 | 0.234 | 0.614* | 1.000 | 0.556* |
| n = 21 | n = 24 | n = 26 | n = 26 | n = 26 | |
| C5 | 0.304 | 0.259 | 0.416* | 0.556* | 1.000 |
| n = 22 | n = 25 | n = 27 | n = 26 | n = 27 |
Countries Coordination Level
Based on these three measures, the e-coordination scores were calculated using a confirmatory factor analysis. Then, the countries were grouped according to their e-coordination score: the limits of weak – medium – strong level were determined by the tertiles of valid country scores (Table 8.5).
Countries distribution by e-coordination strength.
| Weak | Medium | Strong |
|---|---|---|
|
|
|
The last step consisted in the linkage between the strength of the e-coordination and two selected measures: the national expenditure on ‘Governance and health system administration’ and the Current Health Care Expenditure. Tables 8.6 and 8.7 report descriptive statistics of these measures according to the strength of the e-coordination as classified in Table 8.5.
National expenditure on ‘Governance and health system administration’ by e-coordination strength (Euro Per Inhabitant, 2015).
| Weak (n = 10) (as per Table 8.5) | Medium (n = 9) | Strong (n = 4) |
|---|---|---|
| Mean (SD) = 55 (74) Median (Q2) = 25 |
Mean (SD) = 69 (49) Median (Q2) = 59 |
Mean (SD) = 34 (18) Median (Q2) = 38 |
| Q1 = 14 | Q1 = 29 | Q1 = 20 |
| Q3 = 32 | Q3 = 85 | Q3 = 48 |
| Data missing for: Estonia, Ireland, Malta |
Current health care expenditure by e-coordination strength (Euro Per Inhabitant, 2015).
| Weak (n = 10) (as per Table 8.5) | Medium (n = 11) | Strong (n = 4) |
|---|---|---|
| Mean (SD) = 1,598 (1,289) Median (Q2) = 1,167 |
Mean (SD) = 3,175 (2,092) Median (Q2) = 3,912 |
Mean (SD) = 2,599 (1,560) Median (Q2) = 3,028 |
| Q1 = 718 | Q1 = 1,003 | Q1 = 1,422 |
| Q3 = 1,557 | Q3 = 4,938 | Q3 = 3,775 |
| Data missing for: Malta |
Countries with low expenditure, both on governance and health system administration and on health care, belong to the weak e-coordination group; on the other hand, countries with the highest expenditures have a medium level of strength for e-coordination, which could be interpreted by potential ongoing ICT investments to reach a better e-coordination.
Conclusions on Analysing Children’s Primary Health Systems
The MOCHA effort to create a harmonised dataset has contributed to the categorisation of ‘e-coordination’ in three levels of strength and showed how this can be linked to selected measures. The findings presented in this chapter will be then further elaborated with statistical modelling techniques (see Chapter 14) in order to provide an example on how this harmonised dataset can be used to investigate the relationships across measures such as:
the country immunisation coverage;
the presence of mandatory child vaccination policies in the country;
the national economic context; and
the availability, at national level, of electronic health records as well as e-health infrastructures.
A Structural Equation Modelling Approach Applied to MOCHA
Healthcare systems are a very pertinent example of complex systems, both in lay terms by its complicated design and in scientific terms by its non-linear, dynamic, and unpredictable nature. One of the most commonly accepted notions of complexity is the interrelatedness of components of a system (Simon, 1962, 1973, 1996), that is the mutual influence that system components have on each other. Researchers interested in the healthcare systems interrelatedness among multiple factors cannot reach their research objectives resorting to classical statistical methodologies, for example, regression analysis. A statistical solution suitable for dealing with the mutual relationships among variables is the Structural Equation Modelling (SEM).
SEM is a very general statistical modelling technique, widely used in the behavioural sciences, which combine the strengths of factor analysis and multiple regression in a single model that can be tested statistically. Consequently, this statistical modelling technique provides two advantages:
- (1)
It includes, in the model, both manifest (or observed) variables and latent factors.
- (2)
It analyzes the interrelatedness of the factors considered, estimating both the direct effect that a certain factor has on the outcome of interest and the effect mediated by other factors (indirect effect).
The exploration of available measures focused on child health care showed a high variability in the use of diverse measures across countries, outlining a patchy and disperse way in the evaluation of quality of child care (Minicuci et al., 2017). Measures are generally focused on immunisation, mortality and hospitalisation, leaving out other important aspects of child health care (see Chapter 7).
Earlier in this chapter, we have illustrated the Italian CNR Team’s efforts within towards the identification of a comprehensive populated dataset for the investigation of the child healthcare system. In particular, due to the presence of a small number of measures within each of the identified category (Context, Access, Coordination and Governance), the computation of the category-specific score was possible only for a subset of the Coordination measures (e-coordination, see Chapter 7) and, therefore, the investigation of the relationship across the four categories was not feasible. Moreover, the presence of missing values reduced the number of records available for the analysis.
Bearing in mind these limitations, an application of the SEM methodology was performed, as described below, in order to exemplify its potentiality in the investigation of complex research questions.
Example of SEM Model Applied to the MOCHA Dataset
The following gives an example of how we would analyse the interrelatedness of four factors across the MOCHA countries:
- (1)
the country immunisation coverage;
- (2)
the presence of mandatory child vaccination policies in the country;
- (3)
the national economic context; and
- (4)
the availability, at national level, of electronic health records as well as e-health infrastructures.
If we assume we are interested in the following research questions:
Do the countries with mandatory national vaccination have a higher immunisation coverage?
Are the countries with a high adoption of primary care records and e-health infrastructures facilitated in monitoring the individual immunisation status and, consequently, leading to a higher immunisation rate?
Does the national economic context influence:
- (a)
whether the child vaccination is mandatory
- (b)
the adoption of primary care records and e-health infrastructures?
- (a)
Does the national economic context indirectly influence the country immunisation coverage?
The path diagram (Figure 8.1) shows how the above relationships can be described graphically.

Immunisation Coverage
Immunisation is an essential component for reducing under-five mortality. Immunisation coverage estimates are used to monitor coverage of immunisation services and to guide disease eradication and reduction. It is a good indicator of health system performance (Bos & Batson, 2000).
In our example, we focused on the Diphtheria, Tetanus and Pertussis (DTP) vaccine, which conveys immunity to three different infectious diseases. In particular, we considered the percentage of infants who have received first dose of the combined diphtheria, tetanus toxoid and pertussis vaccine in 2017 (DPT1 coverage).
Mandatory Vaccination
All countries in the European Union have a long tradition of implementing vaccination programmes. In the presence of such a large variety of vaccines on offer, the way immunisation is organised differs considerably between countries. There are also large differences in whether vaccinations included in the national programmes are recommended or mandatory.
In our example, we compared the countries where DTP vaccines were mandatory and the countries where these vaccines were recommended.
The following definitions were used:
recommended: a vaccination included in the national immunisation programme for all or some specific groups independent of being funded or not; and
mandatory: a vaccination that every child must receive by law without the possibility for the parent to choose to accept the uptake or not, independent of whether a legal or economical implication exists for the refusal (Haverkate et al., 2012).
Economic Context Factor
The national economic context factor was measured using three variables:
the Gini coefficient, a measure of inequality of income or wealth (Gini, 1936). A Gini coefficient of zero expresses perfect equality, where everyone has the same income. A Gini coefficient of 1 expresses maximal inequality among values, where only one person has all the income and all others have none;
the child relative income poverty rate, defined as the percentage of children (0–17 year-olds) with an equivalised household disposable income (i.e. an income after taxes and transfers adjusted for household size) below the poverty threshold. The poverty threshold is set here at 50% of the median disposable income in each country; and
the child material deprivation, defined as the average number of household amenities and goods that a child does not have access to. The household amenities and goods considered are: (1) a washing machine, (2) a colour TV, (3) a telephone and (4) a personal car, and on the household having the ability to (5) keep the household adequately warm, (6) pay utility bills, (7) meet mortgage or rent payments, (8) eat meat, chicken or fish at least every second day and (9) pay its necessary expenses generally.
The higher the score in this factor the more unfavourable economic context the country has. For this reason, we will refer to this factor as ‘Unfavourable economic context’.
Monitoring Factor
The measures identifying the ‘e-coordination’ factor were used to define the availability of e-health infrastructures. They are as follows:
EHR usage in primary care (C3);
Child Public Health EHR System in Use e-health records (primary care EHR/immunisation registration) (C4); and
e-health infrastructure for sharing with other sectors (C5).
Since the score of this factor increases with the increase in the availability of e-health infrastructures, we will refer to this factor as ‘Monitoring strength’.
The identified model is shown in Figure 8.2.

The results of this SEM modelling are reported in Table 8.8.
Decomposition of the effects estimated by the hypothesised SEM model.
| Effects | Direct | Indirect | Total |
|---|---|---|---|
| On ‘Mandatory vaccination’ (Yes vs No) | |||
| Unfavourable economic context | 0.1079 | – | 0.1079 |
| On ‘Monitoring strength’ | |||
| Unfavourable economic context | −0.0609* | – | −0.0609* |
| On ‘DTP1 immunisation coverage’ | |||
| Mandatory vaccination (Yes vs No) | −0.4638 | – | −0.4638 |
| Monitoring strength | −0.0402 | – | −0.0402 |
| Unfavourable economic context | – | −0.0476 | −0.0476 |
Note: *p < 0.10.
The national economic context results to influence the country monitoring strength, highlighting the negative effect (−0.0609) of an unfavourable economic context on the strength in the monitoring.
The DTP1 immunisation coverage results not to be influenced by neither the obligatory vaccine (the direct effect (−0.4638) is not statistically significant), the strength of the monitoring system (the direct effect (−0.0402) is not statistically significant), nor the economic context (the indirect effect (−0.0476) is not statistically significant). This means that even if a country has a mandatory vaccination, or a strong monitoring system or favourable economic context, its immunisation coverage is not higher than that reported in a country where these three conditions are not fulfilled. If other relevant measures had been available, it would have been possible to identify other potential factors influencing the immunisation rate.
Despite of the limits of this exemplifying SEM model, it clearly shows the potentiality of this statistical technique to simultaneously estimate complex relationships among factors, allowing the decomposition of the total effects of a factor on another one in direct and indirect effect.
Since the indirect effects represent how the influence of a factor on an outcome of interest is mediated by other factors, the SEM approach allows a deeper comprehension of complex mechanisms and, consequently, being able to go beyond the lack of data, it would be a valid instrument to use in further research on child health care.
Service Quality Measurement
Quality Measures
Separate from the assessment of the quality of the healthcare system for children is the assessment of the quality of care delivered within the system, in an operational context. Health Care Quality is a multidimensional concept, since it encompasses a number of aspects to be evaluated. Scientific research as well as the extended vision by the World Health Organization has progressively enlarged the concept of health including other important aspects of the individual’s life related to life style, well-being as well as contextual factors such environmental, economics and socio-cultural. Under a child-centred perspective, scientific evidence underlines that the criteria used to evaluation quality of care for adults cannot be directly translated to children. As reported by Rigby et al. (2003), health determinants, disease patterns, preventive and therapeutic health services and data sources are all different for children compared to adults.
The focussed work the team from CNR Italy undertook within the MOCHA project sought to identify potential quality measures through the exploration of a continuum of feasible measures, from the clinical, health status and satisfaction perspectives, that could be used effectively by the stakeholders within diverse structural models (across countries) and paediatric settings to quantify the impact of the paediatric care.
The main objectives of the analysis were to:
provide an overview of the measures available in internationally open-accessible databases;
develop an ad-hoc questionnaire to collect information on the availability and utilisation of measures to evaluate the quality of the child care in each of the 30 countries;
provide an overview of the measures adopted in each of the 30 countries for the evaluation of child care; and
explore whether the Patient-reported Experience Measures (PREMs) and the Patient-reported Outcome Measures (PROMs) are used in the evaluation of paediatric care in each of the 30 countries.
The MOCHA Analysis
Provided that monitoring child health status and monitoring the quality of child health care are likely to produce different findings, the initial approach taken aimed to distinguish between the measures used to evaluate the child health status, as collected by the international databases, and the measures used to evaluate the quality of the child health care, as reported by the MOCHA CAs (see Chapter 1) through an ad-hoc designed questionnaire applied in each country.
All international databases that were open-access and dealt with a broad spectrum of child health-related issues were searched. Scrutinised sources came from organisations, agencies, research networks and observatories. Ongoing and ended research projects on child care were also investigated. In parallel, an ad-hoc designed questionnaire was developed and administered to the CAs to gather information on:
agencies/organisations in charge of the evaluation of quality of care at national and/or local level;
coverage of quality evaluation specifically devoted to child care;
topics covered in the evaluation of child primary healthcare services; and
measures used to evaluate child care.
In addition to these objective measures, gathering the perspective of patients has been proved to provide a deeper insight as to their experience facing illnesses as well as their interaction with health services. This information is hard to capture through other evaluation systems of quality of care and highlights the difference between measuring children’s ‘objective’ health status using scales and, on the other hand, their ‘subjective’ perception of their quality of life. Thus, the questionnaire included a section on PREMs and PROMs aimed at identifying to what extent these recently introduced tools were adopted across countries as well as applied to child care. In this, a core challenge is that many measures cannot easily be applied to children’s services, while proxy respondents to data gathering such as parents may not always take the child’s or a child-centric view.
Measures’ Classification
To facilitate the analysis, measures collected from the two groups of sources were classified and organised within a schema that represents the principal areas, further detailed in a two-level hierarchy of subcategories (hereafter called topic and subtopic).
The top-down and the bottom-up approach used to classify the measures helped the identification of five main areas that comprise both healthcare and non-healthcare determinants: (1) Structure; (2) Process; (3) Outcome; (4) Social, political, economic and environmental context; and (5) Health-related behaviour. The complete schematic diagram is shown in Figure 8.3.

The finer operationalisation of the 22 identified topics led to a selection 19 subtopics for the ‘Structure’ area, 23 subtopics for the ‘Process’ area, 19 subtopics for the ‘Outcome’ area, 27 subtopics for the ‘Social, political, economic and environmental context’ area, and no sub-topic for the ‘Health-related behaviour’ area.
A comprehensive piece of work to map the different indicators, both those from databases and those in use by countries as reported by the MOCHA CAs, was completed as a MOCHA deliverable and is available on the web site (Minicuci et al., 2017). This includes detailed reporting and mapping of availability of quality-related measures by country. A brief summary is given here.
International Databases
Almost half of the measures fall into the Social, political, economic and environmental context (49%). The second most representative area concerns the Outcome (19.2%) area, whereas the remaining measures are approximately equally distributed among the other three areas. For all countries, the Social, political, economic and environmental context area is the most represented. With regard to the three areas possessing the strongest links with the healthcare system, that are Structure, Process and Outcome, only Cyprus has more than half of its measures (52%) classified in these areas, while Ireland is the country in which these areas are less represented (29.4%).
The distribution of the collected measures among the topics covered by the international databases shows that education is the most represented topic (18.3% of the measures), followed by health status (17.8%) and welfare policy (non-health) (13.9%). Within the process area, one PREM was found concerning self-reported unmet needs for medical examination, while within the outcome area, three PROMs regarding self-perceived health and limitations were present.
Country Agents Questionnaire
Twenty-six countries out of the 30 involved in the project provided answers to the questionnaire on local use of quality measures. Considering the measures reported by CAs, in two countries (Poland and Romania), quality assessment is mainly carried out using healthcare accreditation procedures, relating to the functioning of hospitals and primary health care as well as specialist outpatient care and treatment of addictions, while Greece and Malta have no system in place for quality assessment. Therefore, these countries were excluded from the analysis.
The majority of the measures are related to the Process (50.9%) and to the Outcome (33%) of care. These two areas are covered by the remaining 24 countries (96%) but only six countries (Austria, Germany, Finland, Northern Ireland, Ireland and Latvia) cover all the five areas of the map. About 10.2% of the measures fall in the Structure area, which is covered by 72% of the countries. The remaining two areas account for a 3.1% (Social, political, economic and environmental context area) and a 2.8% (Health-related behaviour area), with a coverage of 68% and 40% of countries, respectively.
The most analysed topic is the health status considering both the number of measures (25%) and the coverage among countries (92%). Another important part of the quality assessment is related to three topics of the process area: specialist/hospital health care (24%), prevention (14%) and primary healthcare management (12%). These results are also confirmed analysing the distribution by country where both the prevention and the health status are analysed in 23 countries (92%) while the primary healthcare management is studied in 20 countries (80%).
PREMs and PROMs
Five countries (Estonia, Germany, Italy, Poland and England) have implemented surveys for both PROMs and PREMs. Austria reported only outcome measures, while Czech Republic, Lithuania, Norway, Republic of Ireland and Spain use only PREMs for their quality evaluation. In Denmark, the same national survey described presents both PROMs- and PREMs-related aspects. Other national surveys, specifically focused on the evaluation of patients’ experiences, have been implemented in Croatia, Norway, Republic of Ireland and England.
Comparison between International Databases and Country Agents Coverage
This comparison pertains to the potential use of feasible and already available measures collected through open-access databases by acknowledging that the considered measure is being used by some European countries, as reported by the CAs, to evaluate the quality of the child health care. Considering the five areas of the map, International databases collect the majority of the measures on the Social, political, economic and environmental context area (49%), while countries focus the attention more on Process (50%). The outcome area is the second most representative for both sources (18% and 33%, respectively). The comparison of the common measures between the International Databases and the Countries led to the identification of 30 measures distributed across all five areas and representing 10 topics, such health expenditure, child care provider/workforce, prevention, specialist/hospital health care, health status, demographic, education, socio-economic and health-related behaviour.
Tracer Conditions
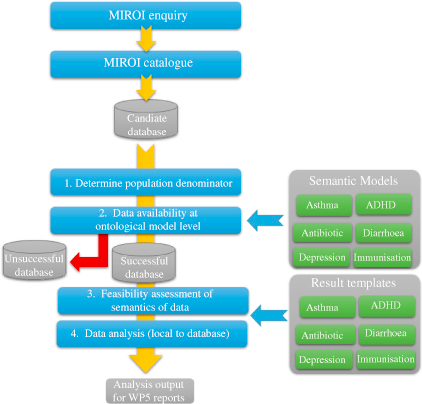
A report entitled Measures of Quality and Outcomes derived from large datasets (Liyanage et al., 2018) undertaken by MOCHA researchers from the University of Surrey have put forward an alternative approach to identifying indicators utilising information on tracer conditions collected from routinely collected datasets.
These tracer conditions cover the totality of care provided for children in primary care including ambulatory-sensitive conditions (such as diarrhoea and vomiting), chronic diseases (such as asthma), mental health and preventative health. However, electronic medical databases and sources of routinely collected data relating to health care across the EU are heterogeneous. Thus, the researchers utilised a method that involved the compilation of a metadata catalogue and semantic models to harmonise case definitions and facilitate comparison from different data sources across the EU (Liyanage et al., 2016, 2017, 2018). This is summarised in Figure 8.4 and outlined in further detail in Liyanage et al. (2018).
Using indicators for these tracer conditions, the researchers found substantial, statistically significant and consistent variation in a number of health services and clinical quality indicators, especially of prescribing practices in primary child care systems based on the models of care adopted (Liyanage, Shinneman et al., 2018).
Conclusion
Chapter 7 has already shown the difficulty identified by the project’s scientists of obtaining data about children, their health and the context in which services are trying to operate. This chapter then takes this further, by looking at approaches to health system quality and delivered service quality. Extensive work was undertaken by an expert group within the MOCHA project and reported separately in a detailed Deliverable, which not least captures an overview of activities in each of the 30 study countries. While this gives a rich analysis of a range of activities, it shows the comparatively early stages of this research in Europe and the opportunity for joint collaborative working at the conceptual and methodological levels, as well as at the data level mentioned in Chapter 7. In terms of the MOCHA project objective of appraising models of child primary health care, the results of this specific work show that the means of appraisal of system and service quality are not yet agreed or mature, as well as having inadequate data to fuel them.
References
Bos & Batson (2000) Bos, E. , & Batson, A. (2000). Using immunization coverage for monitoring health sector performance: Measurement and interpretation issues. Health and Nutrition Discussion Paper. The World Bank. Retrieved from http://documents.worldbank.org/curated/en/607721468763783070/Using-immunization-coverage-rates-for-monitoring-health-sector-performance-Measurement-and-Interpretation-Issues
Cattaneo, Cogoy, Macaluso, & Tamburlini (2012) Cattaneo, A. , Cogoy, L. , Macaluso, A. , & Tamburlini, G. (2012). Child health in the European Union. Luxembourg: European Commission.
Chapple & Richardson (2009) Chapple, S. , & Richardson, D. (2009). Doing better for children. Paris: OECD Publishing.
Gini (1936) Gini, C. (1936). On the measure of concentration with special reference to income and statistics, Colorado College Publication, General Series No. 208, 73–79.
Haverkate et al. (2012) Haverkate, M. , D’Ancona, F. , Giambi, C. , Johansen, K. , Lopalco, P. L. , Cozza, V. , … VENICE project gatekeepers and contact points . (2012). Mandatory and recommended vaccination in the EU, Iceland and Norway: Results of the VENICE 2010 survey on the ways of implementing national vaccination programmes. Retrieved from https:\\doi.org\17.10.2807/ese.17.22.20183-en
Kavanagh, Adams, & Wang (2009) Kavanagh, P. L. , Adams, W. G. , & Wang, C. J. (2009). Quality indicators and quality assessment in child health. Archives of Disease in Childhood, 94(6), 458–463.
Kendall (1938) Kendall, M. (1938). A new measure of rank correlation. Biometrika, 30(1–2), 81–89.
Liyanage et al. (2017) Liyanage, H. , Hoang, U. , Ferreira, F. , Alexander, D. , Rigby, M. , Blair, M. , & de Lusignan, S. (2017). Availability of computerised medical record system data to compare models of child health care in primary care across Europe. Studies in Health Technology and Informatics, 244, 8–12.
Liyanage, Hoang, Ferreira, & de Lusignan (2018) Liyanage, H. , Hoang, U. , Ferreira, F. , & de Lusignan, S. (2018). Report of measures of quality and outcomes derived from large datasets. Retrieved from http://www.childhealthservicemodels.eu/wp-content/uploads/Deliverable-D14-5.2-Report-of-Measures-of-Quality-and-Outcomes-derived-from-large-data-sets.pdf
Liyanage et al. (2016) Liyanage, H. , Luzi, D. , De Lusignan, S. , Pecoraro, F. , McNulty, R. , Tamburis, O. , … Blair, M. (2016). Accessible modelling of complexity in health (AMoCH) and associated data flows: Asthma as an exemplar. Journal of Innovation in Health Informatics, 23(1), 863. doi:10.14236/jhi.v23i1.863
Liyanage et al. (2018) Liyanage, H. , Shinneman, S. , Hoang, U. , Ferreira, F. , Alexander, D. , Rigby, M. , … de Lusignan, S. (2018). Profiling databases to facilitate comparison of child health systems across Europe using standardised quality markers. Studies in Health Technology and Informatics, 247, 61–65.
Minicuci et al. (2017) Minicuci, N. , Corso, B. , Rocco, I. , Luzi, D. , Pecoraro, F. , & Tamburis, O. (2017). Innovative measures of outcome and quality of care in child primary care models. Retrieved from http://www.childhealthservicemodels.eu/wp-content/uploads/2015/09/D7-Identification-and-Application-of-Innovative-Measures-of-Quality-and-Outcome-of-Models.pdf
Ortiz, Daniels, & Engilbertsdóttir (2012) Ortiz, I. , Daniels, L. M. , & Engilbertsdóttir, S. (Eds.). (2012). Child poverty and inequality. NewYork, NY: UNICEF.
Peoples-Sheps et al. (1998) Peoples-Sheps, M. , Guild, P. , Farel, A. , Cassady, C. E. , Kennelly, J. , Potrzebowski, P. W. , Waller, C. J. (1998). Model indicators for maternal and child health: An overview of process, product, and applications. Maternal and Child Health Journal, 2(4), 241–256.
Rigby, Köhler, Blair, & Mechtler (2003) Rigby, M. J. , Köhler, L. I. , Blair, M. E. , & Mechtler, R. (2003). Child health indicators for Europe – A priority for a caring society. European Journal of Public Health, 13(3 Suppl), 38–46.
Simon (1962) Simon, H. A. (1962). The architecture of complexity. Proceedings of the American Philosophical Society, 106, 467–482.
Simon (1973) Simon, H. A. (1973). Structure of ill-structured problems. Artificial Intelligence, 4, 181–201.
Simon (1996) Simon, H. A. (1996). The sciences of the artificial. Cambridge, MA: MIT Press.
Wolfe et al. (2013) Wolfe, I. , Thompson, M. , Gill, P. , Tamburlini, G. , Blair, M. , Van Den Bruel, A. , … McKee, M. (2013). Health services for children in Western Europe. The Lancet, 381(9873), 1224–1234. doi:10.1016/S0140-6736(12)62085-6
World Health Organization Regional Office for Europe (2005a) World Health Organization Regional Office for Europe . (2005a). European strategy for child and adolescent health and development. Copenhagen: WHO. Retrieved from http://apps.who.int/iris/handle/10665/107677
World Health Organization Regional Office for Europe (2005b) World Health Organization Regional Office for Europe . (2005b). European strategy for child and adolescent health and development Information tool. Copenhagen: WHO.
World Health Organization Regional Office for Europe (2014) World Health Organization Regional Office for Europe . (2014). Investing in children: The European child and adolescent health strategy 2015–2020. Retrieved from http://www.euro.who.int/en/health-topics/Life-stages/child-and-adolescent-health/policy/investing-in-children-the-european-child-and-adolescent-health-strategy-20152020
- Prelims
- Chapter 1 The MOCHA Project: Origins, Approach and Methods
- Chapter 2 Models of Primary Care and Appraisal Frameworks
- Chapter 3 Listening to Young People
- Chapter 4 Child Centricity and Children’s Rights
- Chapter 5 Equity
- Chapter 6 The Limited Inclusion of Children in Health and Health-related Policy
- Chapter 7 The Invisibility of Children in Data Systems
- Chapter 8 The Conundrum of Measuring Children’s Primary Health Care
- Chapter 9 Measurement Conundrums: Explaining Child Health Population Outcomes in MOCHA Countries
- Chapter 10 Services and Boundary Negotiations for Children with Complex Care Needs in Europe
- Chapter 11 School Health Services
- Chapter 12 Primary Care for Adolescents
- Chapter 13 Workforce and Professional Education
- Chapter 14 e-Health as the Enabler of Primary Care for Children
- Chapter 15 Affiliate Contributors to Primary Care for Children
- Chapter 16 The Transferability of Primary Child Healthcare Systems
- Chapter 17 National and Public Cultures as Determinants of Health Policy and Production
- Chapter 18 Bringing MOCHA Lessons to Your Service
- Chapter 19 Evidence to Achieve an Optimal Model for Children’s Health in Europe
- Appendix 1: List of MOCHA Scientists
- Appendix 2: List of MOCHA Country Agents
- Index